Attributed reporting
Utrecht Science Park gets an interactive map of heat, shade and flooding
Utrecht University has published a 3D map of the Science Park showing where it feels hot, where shade falls and where rainwater lingers.
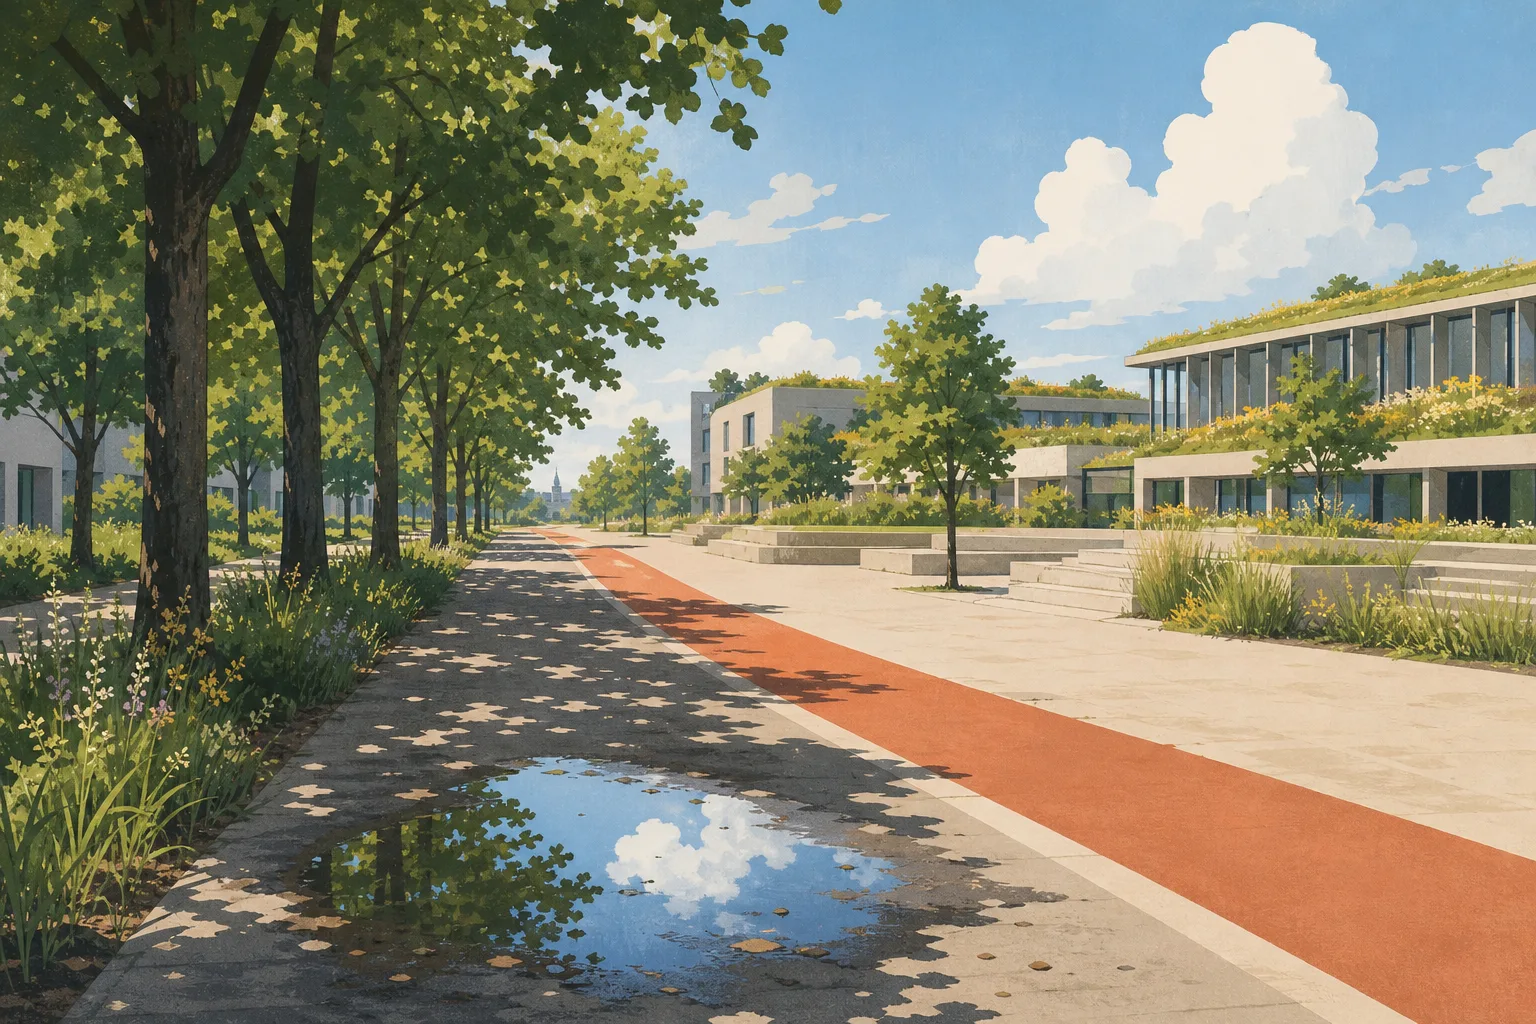
Utrecht University has published an interactive 3D map of Utrecht Science Park that brings together data on buildings, trees, water, heat and public space. The university announced the tool on 27 October 2026. It is meant to show where the campus area on the eastern edge of the city is vulnerable to a warming climate.
What the map shows
According to the university, the map covers several layers. It shows the perceived temperature on a summer day and how trees and buildings influence it, where shade falls at different times of day, and where water stays on streets after heavy rain. It also displays soil moisture and soil temperature, taken from sensors in the ground.
Survey results are included too. In 2025, people at six locations in the Science Park were asked to respond to twenty statements about safety, perceived heat and shade, and those answers have been added to the map.
Where it comes from
The university says the map grew out of the Living Lab Healthy Heidelberglaan. On its climate adaptation page, the university describes that living lab as a place that monitors air quality and user experience, tests climate adaptation solutions, and measures temperature and wind flows to identify areas that are becoming unhealthily warm.
Who is it for
The university names several audiences. Property managers and area developers can use it to plan greenery, shade and other climate-risk measures. Researchers and students can request the soil sensor data. Residents and other users of the area can use the map, in the university's words, as "a practical way of looking at their surroundings", and to raise local issues with the responsible organisations.
The data also feeds into the university's climate adaptation programme and will help shape its climate adaptation action plan. That programme sets out goals including that, by 2030, every construction and renovation project takes the changing climate into account, and that by 2040 campus temperatures should not feel more than 5 degrees warmer than outside the city. It also lists planting at least 750 new trees in the Science Park, according to the university's programme page.
What it does not yet do
The map is a planning aid rather than a final assessment. The temperature layer shows perceived temperature on a hot day, not measured air temperature, and the survey drew on six locations. The university says more sensors, measuring local conditions such as temperature and wind, will be installed in 2027, which suggests the picture will become more detailed over time. The announcement does not say who built the map or what it cost.
Why it matters for residents
Utrecht Science Park is home to the university, UMC Utrecht and many companies. Heat, drought and sudden downpours affect the wider city too. The map gives users a visual way to examine how trees and buildings relate to conditions across the campus. It is available online through the university's announcement page, which links to the interactive viewer.
Sources
- New interactive map highlights climate risks in Utrecht Science Park
Published by Utrecht University
- Climate adaptation
Published by Utrecht University