
Analysis
Utrecht's paid-parking gamble: what the evidence actually shows
Utrecht is bringing paid parking to every neighbourhood by 2034. Early measurements show less pressure where charges begin—but much less certainty about car ownership, travel behaviour and who bears the cost.
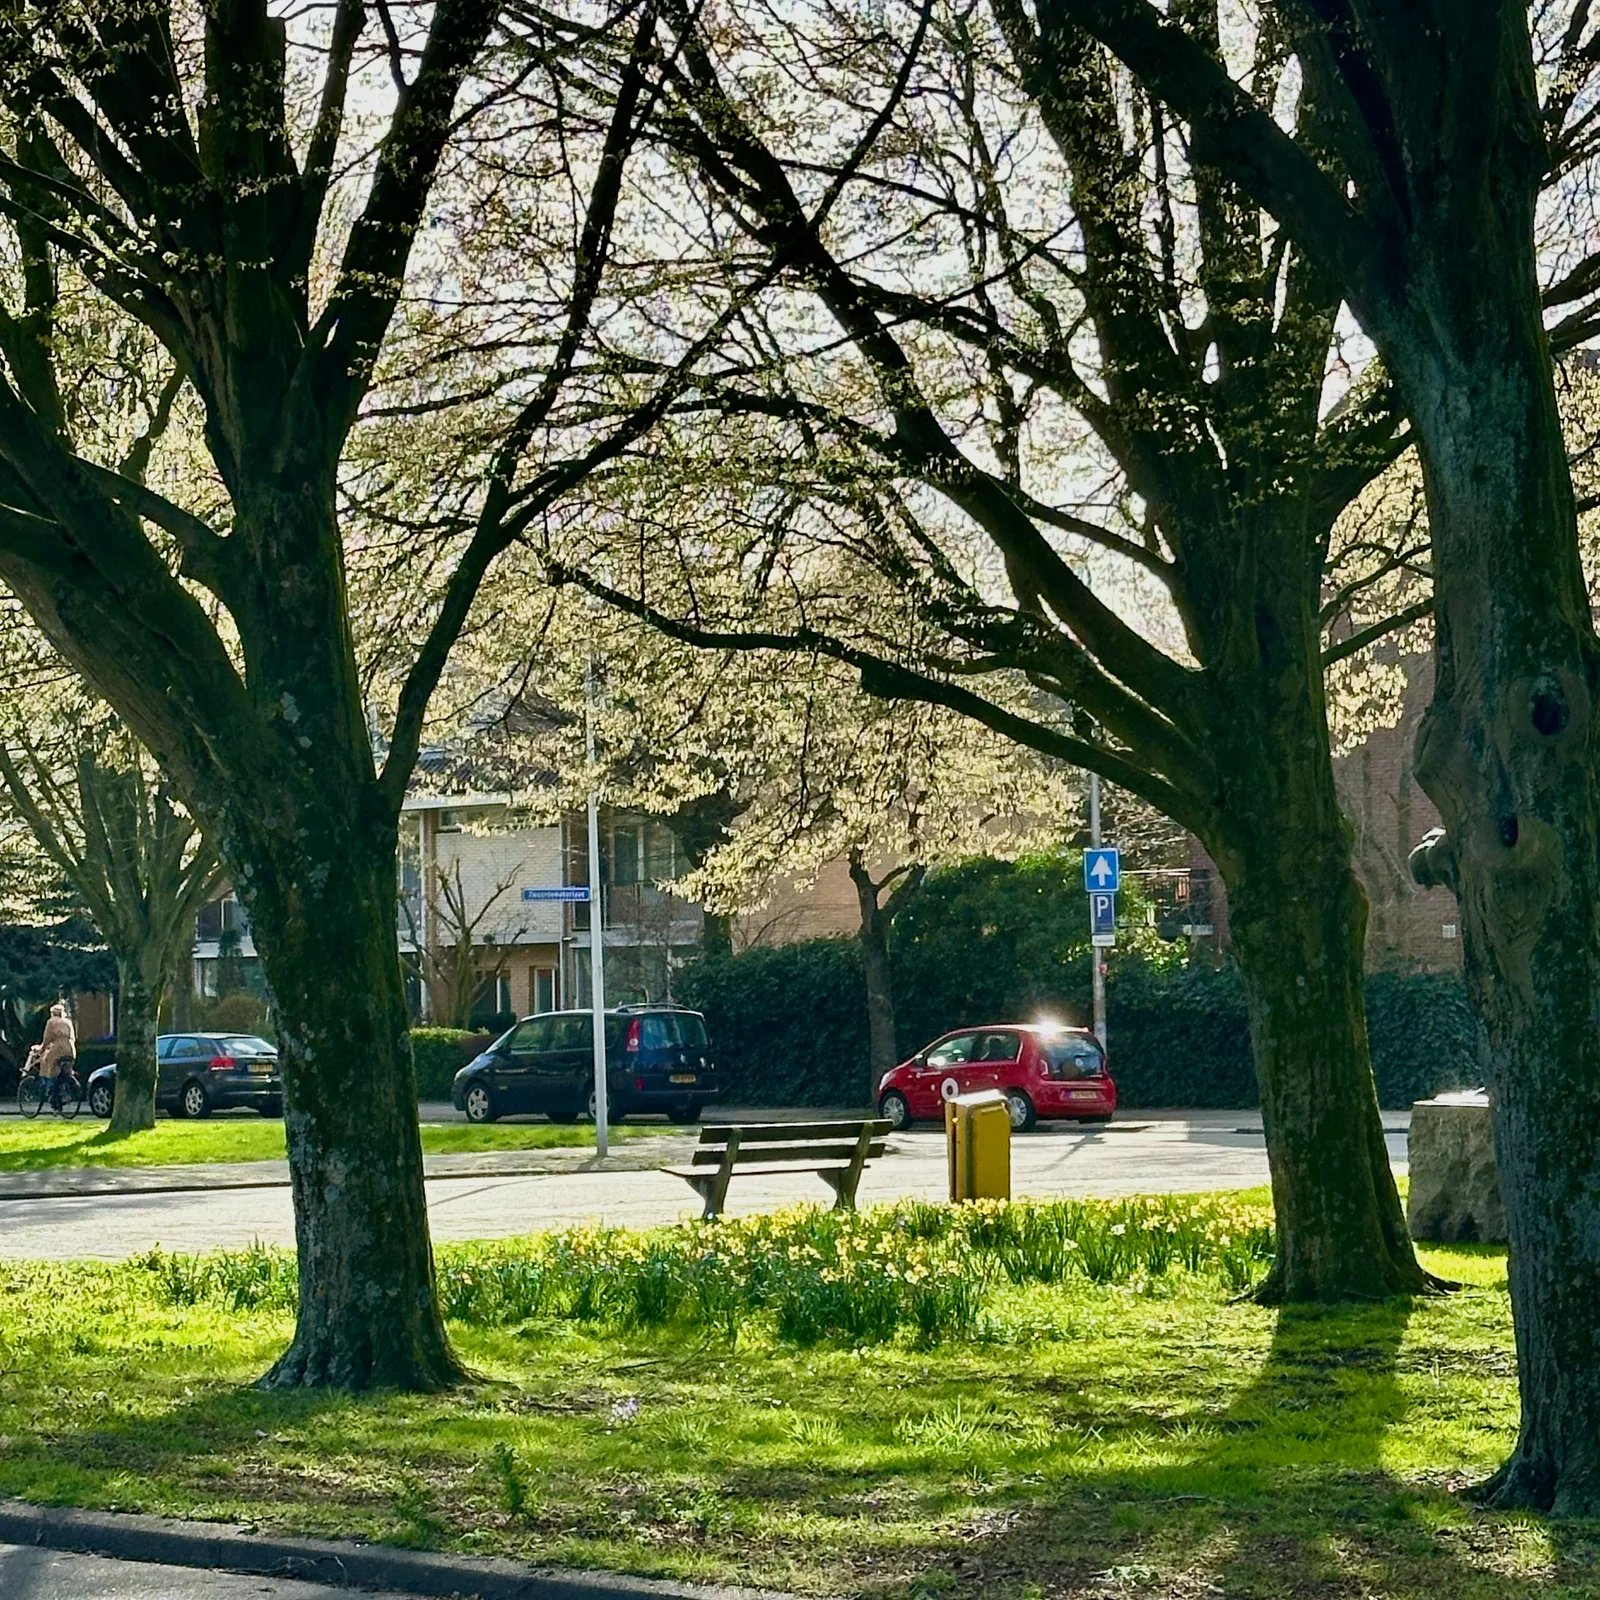
Utrecht has committed itself to an unusually broad experiment. By 2034, every public street-parking space in the city is meant to be paid parking. Neighbourhood by neighbourhood, the remaining free areas are being absorbed into one regulated system.
The policy comes with a confident promise. Paid parking should reduce nuisance, make the city easier to reach, encourage cleaner forms of transport and release scarce public space for trees, bicycles, play and places to meet. It should also be fairer, the municipality argues, because the people occupying that space with a car will pay for it.
There is now enough evidence to test part of that promise. The early results are real: parking pressure and complaints fell sharply in several neighbourhoods after charging began. But Utrecht’s own documents are equally clear about what they cannot yet establish. They do not show that paid parking itself has reduced car ownership. They do not demonstrate a neighbourhood-level shift from driving to cycling or public transport. And they do not reveal how the costs are distributed between households with different incomes.
That distinction matters as the city prepares for the next, much larger phase of the rollout.
From selected streets to the entire city
Utrecht has used paid parking for years, particularly in and around the centre. The present policy is different in scale. A council decision extended the principle to all neighbourhoods where parking is still free, with implementation divided into three blocks.
Block 1, covering areas introduced during 2024 and 2025, is complete. Block 2 is scheduled to begin on 1 November 2026 and continue through 2030. Block 3 is planned for 2031 to 2034. According to the final municipal implementation programme, the share of paid on-street parking needs to grow by an average of roughly 6.25 percentage points each year to reach the citywide target.
In most new residential areas, charging will apply only from 06:00 to 11:00 on weekdays. Utrecht says this short window is enough to discourage commuters from leaving cars in residential streets while keeping parking free for much of the day and throughout the weekend. Neighbourhoods with many shops or other facilities may receive longer hours.
That is a softer system than the headline “citywide paid parking” suggests. It is still a profound change for residents in areas where the kerb has never carried a price.
The strongest result: less local pressure
The clearest evidence in favour of the policy concerns its most immediate objective. The covering letter for Utrecht’s Mobility Plan Monitor 2026 says parking pressure was lower after paid parking began in six of the eight areas with comparable before-and-after measurements. It rose slightly in two.
Reports of parking nuisance show a similar short-term pattern. In the Egelantierstraat area, the number of reports fell from 184 between January and April 2025 to 25 between 1 May and 21 July. In Kanaleneiland-Zuid, reports fell from 419 to 150. In Oog in Al, they fell from 97 to 31.
The periods are not the same length, and reports are not the same thing as measured occupancy. A resident may stop reporting because a problem disappeared, because enforcement became visible or simply because they no longer expect a response. Even with those qualifications, the scale and consistency of the falls are difficult to dismiss.
Paid parking changes who is willing to leave a car on a street. In the neighbourhoods measured, fewer drivers competed for the same space and fewer residents reported nuisance. On that narrow but important question, the policy appears to work.
The problem moves before it disappears
The result becomes more complicated at the edge of a charging zone. Both the mobility monitor and the September 2025 parking progress letter describe a “waterbed effect”: pressure falls inside the paid area and rises in adjacent streets where parking remains free.
Dr. Schaepmanstraat provides a concrete example. After charging began there, reports increased in the neighbouring Joh. Uitenbogaertstraat sub-area. The total for the wider Julianapark area therefore rose even though conditions improved on the streets covered by the new regime.
The municipality argues that this displacement will fade as the paid area expands. That is plausible and helps explain the logic of citywide implementation: if every nearby street is regulated, there is no free boundary to which commuter parking can escape.
But it also means that residents at the edge may experience years of shifting pressure while the three-block rollout advances. A citywide endpoint may solve a problem that the phased route temporarily intensifies.
What happens to the space?
Reducing the number of parked cars is not the final objective. Utrecht wants to use the released space for something else. Since 2022, the municipality says 436 parking spaces—132 of them in 2025—have been converted into bicycle parking, greenery or places for people to spend time.
That is visible progress, but it is behind the city’s own programme-budget target of 1,126 removed spaces. Projects were delayed into 2026. The count also tells us only that a parking space changed function, not whether the replacement is well designed, well used or valued by nearby residents.
This is one of the policy’s underexamined questions. The city measures how many spaces disappear, but the reviewed public documents do not systematically measure the quality of what replaces them. A planted strip, a bicycle rack and a pleasant pocket park all count as converted space; they do not create the same public benefit.
High prices, short hours
Utrecht’s parking prices are substantial. In 2025, the formal hourly rate was €7.84 in zone A1, €6.79 in A2 and €5.22 in zone BC. Residents’ registered visitors paid half of those rates. Informal carers and home-care and maternity-care workers could pay 25% of the normal rate under specific arrangements.
Permit costs vary by product and zone. The first resident permit in zone BC cost €41.37 per quarter in 2025; additional resident permits cost €103.44. An all-zones annual permit for paid on-street spaces cost €6,418.71.
Prices cannot sensibly be compared without the charging hours. Utrecht’s own comparison with Amsterdam, Rotterdam and The Hague notes that the city combines relatively high hourly rates with short windows in many residential areas. A visitor arriving after 11:00 may pay nothing where the BC-short regime applies.
The municipality expected approximately €3.5 million in revenue from residents’ visitors in 2025. It estimated that raising the visitor discount from 50% to 75%, with the same charging hours, would reduce that revenue by around €1.8 million. That figure exposes an unavoidable tension: a more generous discount reduces the burden on social visits, but also removes income from the parking system.
Fairness is asserted more clearly than it is measured
Utrecht frames the policy as a fairer distribution of scarce space. A parked car occupies public land, so the user rather than the general taxpayer should bear the cost. That argument is coherent, but it answers only one meaning of fairness.
Another is ability to pay. Utrecht offers adults eligible for the U-pas an annual budget of €150, of which up to €105 can be used for a resident permit or public transport. By 16 May 2025, 333 applications for parking support had been submitted and 277 approved. Targeted discounts and arrangements also exist for care.
Those measures show that the city recognises affordability as a problem. They do not tell us whether the support is sufficient, how many eligible residents fail to apply, or whether fines and visitor costs fall disproportionately on households with lower incomes.
A 2023 Radboud University master’s thesis found associations between higher permit fees and lower private car ownership, lower reported utility from car mobility and different effects across income groups. It is useful evidence for asking sharper questions, but it is not a definitive causal evaluation of Utrecht’s citywide policy. In particular, its abstract does not establish that lower-income residents experience the greatest burden.
Municipal monitoring still lacks the distributional data needed to settle that question.
Fewer cars on the road—but because of paid parking?
Weekday motor-vehicle traffic to and from Utrecht has been stable in recent years and is approximately 5% below its pre-pandemic level, despite the population being 7% larger than in 2019. Almost half of car journeys ending in Utrecht are shorter than ten kilometres. Utrecht presents cycling, e-bikes and public transport as realistic alternatives for many of them.
Those figures support the wider direction of the city’s mobility policy. They do not isolate the effect of parking charges. Streets have been redesigned, speed limits reduced, public transport changed, homes built and working patterns transformed since the pandemic. All can affect traffic.
Car ownership makes the picture still less straightforward. Utrecht recorded 124,463 passenger cars on 1 January 2025, equal to 330 per 1,000 residents. Private registrations had increased since 2019 while business lease registrations fell. The municipality explicitly says the influence of paid parking cannot be separated from the many other factors affecting ownership.
The final implementation programme makes the same methodological warning more broadly: changes in parking pressure, ownership and travel behaviour cannot be attributed one-to-one to paid parking.
That honesty should shape how the policy is judged. Stable traffic is not proof that citywide charging caused stable traffic. Rising registered car ownership is not proof that charging failed. The evidence needed for either conclusion does not yet exist.
What Block 2 needs to prove
The first phase gives Utrecht a defensible answer to one question: paid parking generally reduces parking pressure in the streets where it is introduced. Block 2 should be judged against harder questions.
Does the morning-only window keep commuters away over the long term, or merely change when and where they park? Do households give up second cars, or park them on private land and outside the zone? Do residents actually shift journeys to bicycles, public transport or shared cars? Who receives the benefits of redesigned streets, and who pays the permits, visitor charges and penalties? What happens to shops, sports clubs and care organisations?
The municipality’s monitoring framework names several of these indicators, but public neighbourhood-level time series are not yet available. Without them, the strongest promises remain policy objectives rather than demonstrated outcomes.
Utrecht’s paid-parking gamble is therefore neither an obvious failure nor a completed success. It is already producing less crowded streets in several measured areas. Whether it also produces a less car-dependent and more equitable city is the much larger claim—and one the next eight years of evidence still have to earn.
Sources
- Implementation Programme for the Introduction of Paid Parking 2025–2028
Published by Municipality of Utrecht